Note
Go to the end to download the full example code
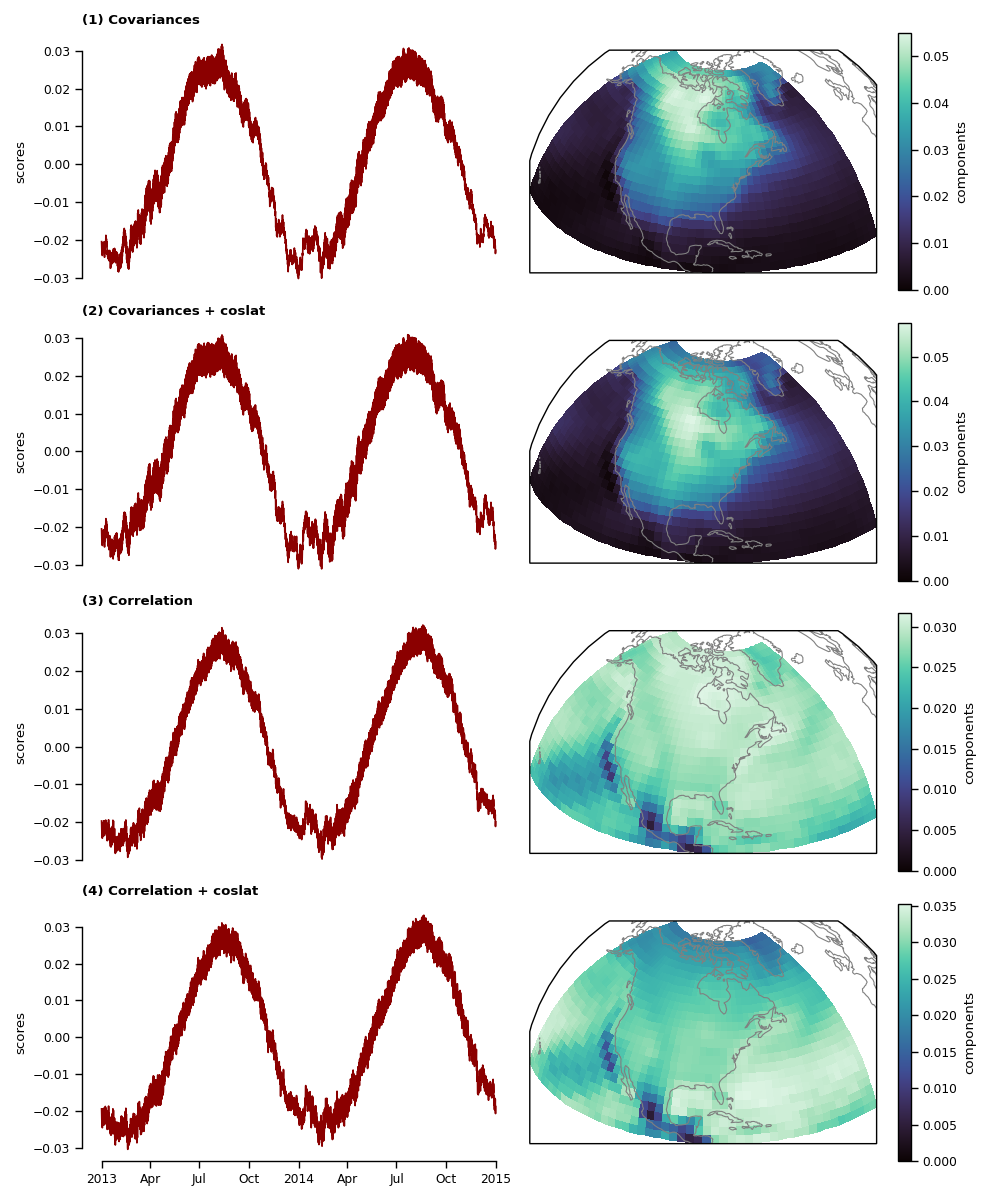
Weighted EOF analysis#
Weighted EOF analysis (in S-mode) maximises the temporal variance considering each gridpoint with a different weight. We compare the results for an EOF analysis based on (1) the covariance matrix, (2) area weighting based on latitude (coslat weighting), (3) the correlation matrix and finally (4) correlation matrix + coslat weighting.
Load packages and data:
import xarray as xr
import matplotlib.pyplot as plt
import seaborn as sns
from matplotlib.gridspec import GridSpec
from cartopy.crs import Orthographic, PlateCarree

from xeofs.models import EOF

sns.set_context("paper")

t2m = xr.tutorial.load_dataset("air_temperature")["air"]
Perform the actual analysis
components = []
scores = []
# (1) Based on covariance matrix
model_cov = EOF(n_modes=5, standardize=False, use_coslat=False)
model_cov.fit(t2m, "time")
components.append(model_cov.components())
scores.append(model_cov.scores())
# (2) Based on coslat weighted covariance matrix
model_lat = EOF(n_modes=5, standardize=False, use_coslat=True)
model_lat.fit(t2m, "time")
components.append(model_lat.components())
scores.append(model_lat.scores())
# (3) Based on correlation matrix
model_cor = EOF(n_modes=5, standardize=True, use_coslat=False)
model_cor.fit(t2m, "time")
components.append(model_cor.components())
scores.append(model_cor.scores())
# (4) Based on coslat weighted correlation matrix
model_cor_lat = EOF(n_modes=5, standardize=True, use_coslat=True)
model_cor_lat.fit(t2m, "time")
components.append(model_cor_lat.components())
scores.append(model_cor_lat.scores())
Create figure showing the first mode for all 4 cases
proj = Orthographic(central_latitude=30, central_longitude=-80)
kwargs = {
    "cmap": "mako",
    "transform": PlateCarree(),
    "vmin": 0,
}
titles = [
    "(1) Covariances",
    "(2) Covariances + coslat",
    "(3) Correlation",
    "(4) Correlation + coslat",
]
fig = plt.figure(figsize=(10, 12))
gs = GridSpec(4, 2)
ax_pcs = [fig.add_subplot(gs[i, 0]) for i in range(4)]
ax_eofs = [fig.add_subplot(gs[i, 1], projection=proj) for i in range(4)]

for i, (a1, a2) in enumerate(zip(ax_eofs, ax_pcs)):
    a1.coastlines(color=".5")
    components[i].sel(mode=1).plot(ax=a1, **kwargs)
    scores[i].sel(mode=1).plot(ax=a2, color="darkred")
    a2.set_xlabel("")
    a1.set_title("", loc="center")
    a2.set_title("", loc="center")
    a2.set_title(titles[i], loc="left", weight="bold")
    if i < 3:
        a2.set_xticks([], [])
        sns.despine(ax=a2, trim=True, bottom=True)
    else:
        sns.despine(ax=a2, trim=True, bottom=False)

plt.tight_layout()
plt.savefig("weighted_eof.jpg", dpi=200)
Total running time of the script: (0 minutes 1.928 seconds)